
The stock scanner that we provide is super-fast for screening technical analysis and candlestick patterns. Every preset inside the scanner can be quickly cloned and adjusted to fit the need of your strategy. One of the time-saving benefits that our members get is the ability to back test the stock scans and set alerts. When our system detects a stock which meets one of your scans, it will email you at the end of the day.
Saving time is awesome. Time is one of the only things in this world that we can’t buy with money, but inside StockMonitor.com you can. Rather than spending hours checking charts manually our stock scanner can do that for you in a matter of seconds. Some of the popular scans that our members are using are the golden cross screener, candlestick scan, moving average crossover detection, breakouts and increasing momentum.
In this post I’d like to highlight these popular stock scans give you a brief description of how each one works.
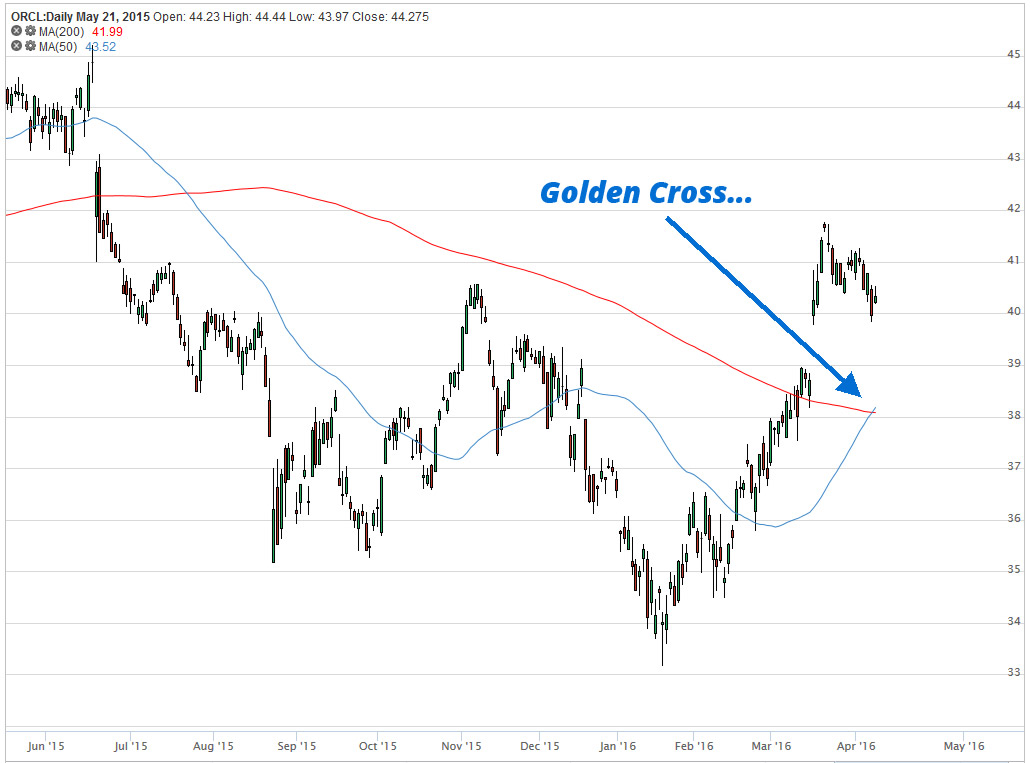
Golden cross stock screener
The golden cross is a moving average crossover which traders around the world look for. It is a 50 period moving average crossing up above the 200 period moving average. These are long-term settings for a moving average, and a great indication of strength during the previous two or three-month period. There are many strategies which investors use that only buy stocks while the 50 moving average is above the 200.
To find stocks which have crossed we have a preset golden cross filter, you find it in the main stock filter window in the moving average menu box. You can run this on symbol sets such as indexes like the Dow Jones, S&P 500, NASDAQ or any personal watchlist that you have built inside our platform.
If you’d like to save even more time, you can always set an alert. At the end of the day you will get an email telling you that the golden cross screener has detected some new stocks.
Candlestick scanning
Candlesticks are found on most stock charts. The candlestick body is defined by the distance between open and the close of the day, the high and the low create what are known as “wicks” from the candlestick body. Although candlesticks are just another way of looking at the price, the type of candle formed can also give you an indication of the type of price action which is happening.
For instance and upward hammer pattern can show you that price attempted to go lower and was bought back up during the period to close above the open. This can be a signal that the bulls are in control.
Another example of how a candlestick pattern can show you what investors are thinking is the Doji candlestick. A Doji candlestick has a very small body because the open and close are either the same, or very close together. It then has a wick above and below which shows that neither the Bulls nor the Bears could take control of the direction. Often when price breaks beyond these candles it is an indication of which side has gained control of momentum.
There are tons of candlesticks that you can scan inside StockMonitor.com. In fact we have a whole menu box titled chart patterns to select from. One neat trick here, is that you can use the candle offset feature on the main filter window, and see the pattern detected one, two, three, four and more days ago. This gives you an easy visual on what happened next.
Breakout stocks
There are many traders who look for a stock which has broken out from a range, maybe a 10 day, 30 day, 60 day or 52-week high. If you would like to find stocks which are breaking out as part of your trading strategy, we have preset filters which can do this for you instantly.
In the menu titled “Price / Gaps / Breaks” you can select preset filters which will pull up stocks that have broken these levels. There are also presets for breaking long term lows, and as an early warning, we have a scan that detects prices which are approaching long-term highs or lows.
Momentum stocks
If you want to profit from the price of a stock and usually you would buy when there is some momentum in the price. If the price of a stock is trending (higher lows, higher highs) and momentum has been rising then you can often find a good opportunity to make some profit.
In our trend indicators menu on the main filter you can use our stock scanner to find prices that have been rising in momentum over varied periods. For instance, momentum rising over three days, five days or more.
In addition to this if you are trying to identify pullbacks in the trend then you can use the momentum falling filters. If the general price has been rising in an upward trend and momentum begins to fall for a few days, it could signal an area for an entry point. You would look for the stock to close up after a period of falling momentum, and base your stoploss around the trend.
These are just some of the filters which are members of benefiting from every day. You can add the stocks that you find in your watch lists which are unlimited. From the watch list you can export the symbols as CSV files when needed.
You can try this out and see the benefit for yourself by signing up to our completely free seven-day trial. There is no payment required to gain full access, but we think you’ll agree that our price is a complete steal for the time it will save you.