A popular way to trade is to buy or sell breakouts. Stocks which are crossing above resistance, or breakout below a support can be excellent trades if you get in whilst there is momentum building.
The problem for many traders is identifying the stocks which look likely to breakout.
In this post you will learn how to find great candidates for breakout stock trades. We will combine a few of our pre-set filters in StockMonitor and pull up a list of stocks so you can monitor them for an entry.
[2019 EDIT] Please note. Our platform has been fully redesigned inside since this post was written. All features still remain, but the layout and navigation is now improved.
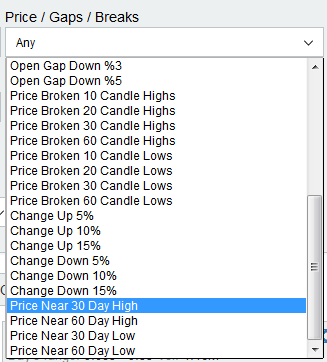
First, inside the filter you will see various boxes, in each a huge selection of price actions patterns, indicators and more. One of the new additions to our pre-sets is “Price near 30 day high”, “Price near 60 day high”, “Price near 30 day low”, “Price near 60 day low”.
These new pre-set filters will pull up stocks that are sitting within 0.5% of their 30 day and 60 day highs or lows. If you would like to find more stocks, you can edit this filter to find stocks within 0.8 or 1%, and save it as a custom version.
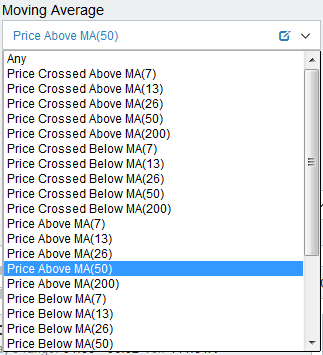
Step 1. Select “Price near 30 day high” filter from the Price / Gaps / Breaks menu.
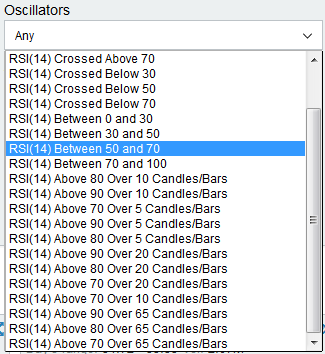
Step 2. Select “RSI Between 50 and 70”. This pulls up stocks which are strong (above 50) but not overbought (above 70). They should have room to gather momentum.
Step 3. (Optional) Select “Price above MA50”. Depending on your time frame, some traders prefer only trading stocks which are above, or below, a Moving Average. 50MA, 100MA, and 200MA are the ones which are the most followed indicators.
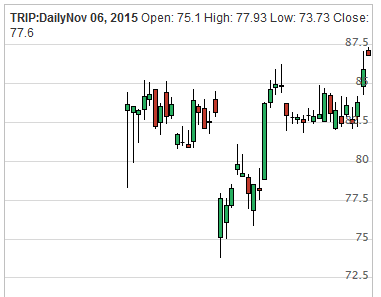
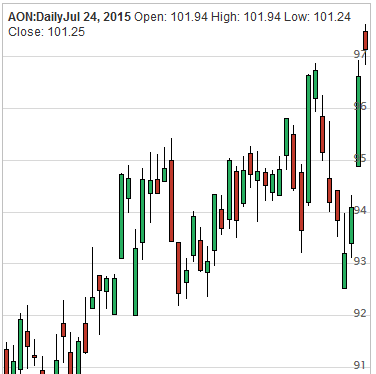
Once you have selected these, you’ll see a selection of stocks in the charts below the filter boxes, and right away I have found 2 which stand out from a list of 12.These are TRIP and AON. Charts below.
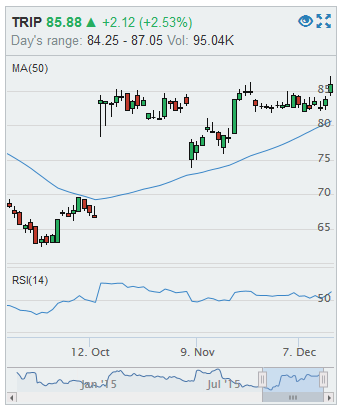
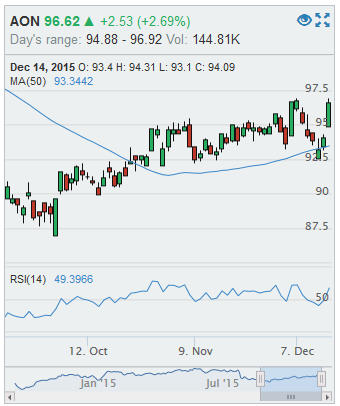
Both these stocks look like they could breakout higher. If the last candle high is broken, and the RSI continues the momentum, it could offer a great opportunity to get into a new move in the trend.
Add any interesting stocks to a watch list in StockMonitor, and continue to view them over the coming days. If you use our main analysis chart, you can also see brief news bullets next to each stock, so when a breakout occurs you will see if news is moving it up.
Make This A Custom Filter.
If you’d like to speed this process up, you can go into our filter builder,add the 3 conditions above then save it as your own filter. Next time you visit just select it from the custom filter list and speed up your analysis!
EDIT
After the market opened, both those stocks have broken out above their highs.
Here are he charts one hour after market open.