
Let me show you how to use Relative Strength Index to find great momentum, breakout and divergence points on your stock charts. It’s one of the most used indicators by traders, and similar to a moving average, you should be watching it too.
The Relative Strength Index is referred to as RSI. If you are wondering how to use RSI, it’s really quite simple once you have played around with it for a short while. So, to get started, log in to your StockMonitor account and load up the technical analysis charts, from the main menu.
Steps To Get Started
Step 1. On the toolbar above each chart you have the “Indicators” menu item. Click this and scroll down the list to find Relative Strength Index. Click on that, and if it turns “green” it has been added to your chart.
![]()
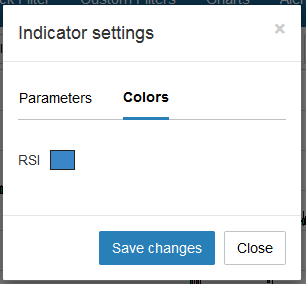
Step 2. If you would like to adjust the settings, there is a cog icon in the left top corner of the RSI indicator window on the chart. Click that and you can use the box to change color, and slowness of the Relative Strength, however the default setting of 14 is what most traders use.
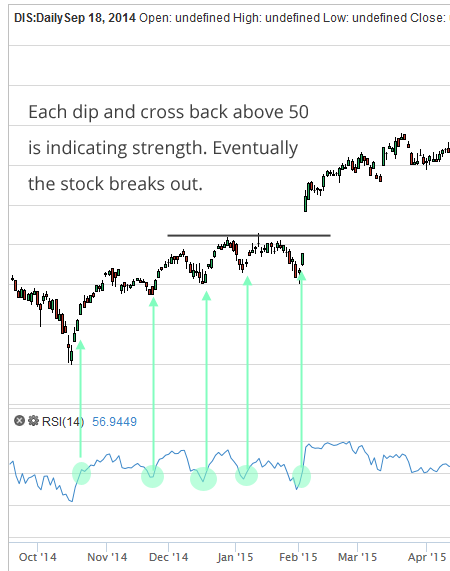
Step 3. In the RSI window you will see the indicator cross above and below 50. This is how to use the Relative Strength Index to show momentum from lows in a trend, or to warn you a stock may have turned. See below and the many times it crosses along with price action before we have breakout.
Finding Divergence With Relative Strength Index
Another way traders use Relative Strength Index is to indicate divergence between price and the indicator. How to use it this way is as follows.
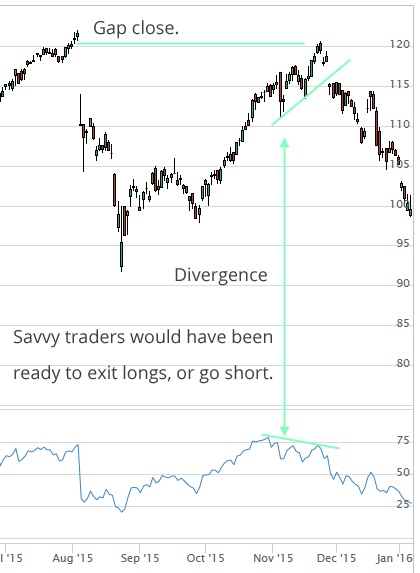
When a stock approaches a significant longer term level, and has been making higher highs or lower lows, you should be looking for an opposite divergence in the RSI. Whilst this is not by any means a holy grail, if there’s a significant reason for a stock to stall at a certain point, maybe a resistance, support, fib extension, gap close, then the divergence could give you a “heads up” to be ready for a failure and reversal.
This example should explain the idea better. DIS (Disney) was heading higher, and nearly at the top of the large gap in price from earlier in 2015. As it approached the top, notice that the RSI was falling. Each higher high in price was met with a lower level in RSI. Thus a divergence was formed. The stock went on the retrace the whole move up.
Divergence happens time and time again in stocks, but don’t get too hung up on it. For me, it’s only useful at resistance, support or gap closes. Picking tops of bottoms can be a hell of a way to lose money, and if you plan to use the Relative Strength Index like that, make sure you have a secondary indicator or trigger to tell you it’s safe to enter.
For those of you who like to see things being done instead of reading, I prepared this short video to show how to use the Relative Strength Index, how to add it to your chart, and how to draw trend lines for spotting divergence. Enjoy and share.