
One of the most common candlestick patterns you can scan for is the Doji candle. It signifies a period of indecision, uncertainty or hesitation. Often they are found near tops and bottoms in trend changes, and at continuation or consolidation points.
Why?
It’s because these candlesticks are where the buyers and sellers are battling it out for direction. The candle is a small body (open to close) with long wicks (high and low).
This pattern shows that during the period the price tried to move higher, and lower but in the end closed near it’s open. Neither the bulls, nor the bears managed to take control.
If you scan for this pattern, and you find a Doji candlestick at a high or low of a move, it’s worth watching for where the price heads next. The next direction on your trading chart may signal a change or a continuation of a trend.
If you simply use your eyes to observe charts to find these patterns, you will be on all day wasting a ton of time. Using an automated scan lets you filter our the charts and find just the ones that pass the rules.
[2019 EDIT] Please note. Our platform has been fully redesigned inside since this post was written. All features still remain, but the layout and navigation is now improved.
How Can You Scan For Doji Candlestick Patterns?
Using the stock filter tool inside Stock Monitor you can scan for any candlestick pattern easily. On the main filter page look in the drop down menu that is titled “Chart Patterns”.
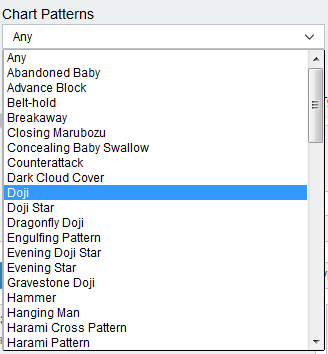
You will see 3 types of Doji to select.
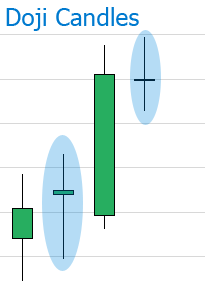
1. is standard Doji which we discussed above. See how this looks below.
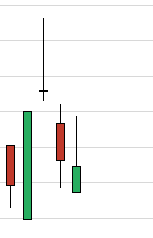
2. Doji Star takes a similar form, but is found hovering like a star, away from the previous candle, usually after a long bullish or bearish candle. (See below).
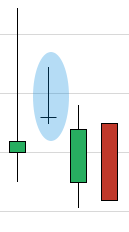
3. Dragonfly Doji is like a hammer candle, with a long wick and very small body. Infact the body should be pretty much non-existent. See below.
You can run the candlestick pattern scan on your watch lists or on any index set of stocks. You can also use the “Candle Offset” to find the patterns which occurred on the previous day, 1, 2, 3, 4 days ago. This allows you to quickly see how effective they may have been on certain stocks.