
If you’d like to find the most overbought or oversold stocks today, or any day, we’ve made this really simple to do inside stockmonitor.com. With the new addition of popular stock scans to our technical analysis screener you can find overbought stocks in seconds.
In this article I’ll quickly run over what our scanner looks for, how it determines whether a stock is oversold or overbought and a short tutorial video of how to do it.
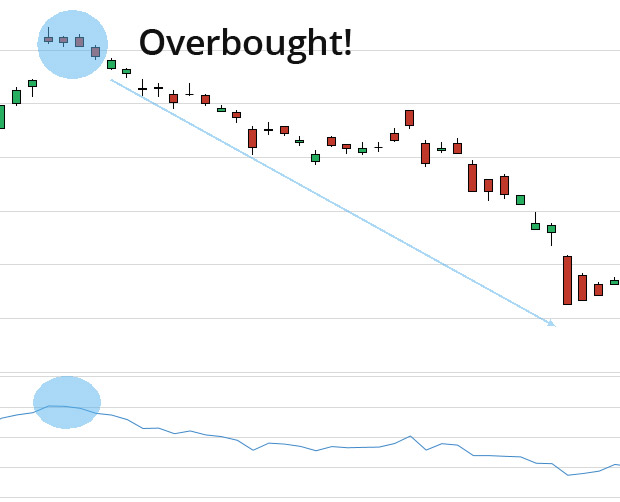 The main way to tell if a stock is overbought or oversold is to use a relative strength index. This indicator if over the 70 level is commonly thought to be overbought, if under the 30 level it is usually classed as oversold. However, in our scanner to narrow down the candidates we also use a high or low value in the stochastic indicator.
Often when a RSI indicator is at the high level it can stay there for quite a while. By adding the stochastic we are determining which of these stocks are overbought or oversold and also at a possible extreme.
We also have a version of this scan which uses the same two indicators but looks for momentum to be falling or rising during a three-day period. This can indicate a stock that is overbought or oversold, is at an extreme with stochastic and could be looking to reverse.
You can add any of these stocks that you find really quickly to watchlist or portfolio direct from the filter results table. Simply select the check boxes and click the button above the table.
Watch a short video below and see how easy it is to find these stocks, and how quickly it is to add them to watchlist or portfolios.
[2019 EDIT] Please note. Our platform has been fully redesigned inside since this post was written. All features still remain, but the layout and navigation is now improved.