
If you are a member then you will have noticed the brand new design of the internal platform. It has taken great time and a lot of testing to get to this stage, and importantly for us to keep all the features you have grown to love at StockMonitor in place and easy to find. We have had great feedback, so let us show you some of the basics of the new improved design.
Stock Scans and Filters
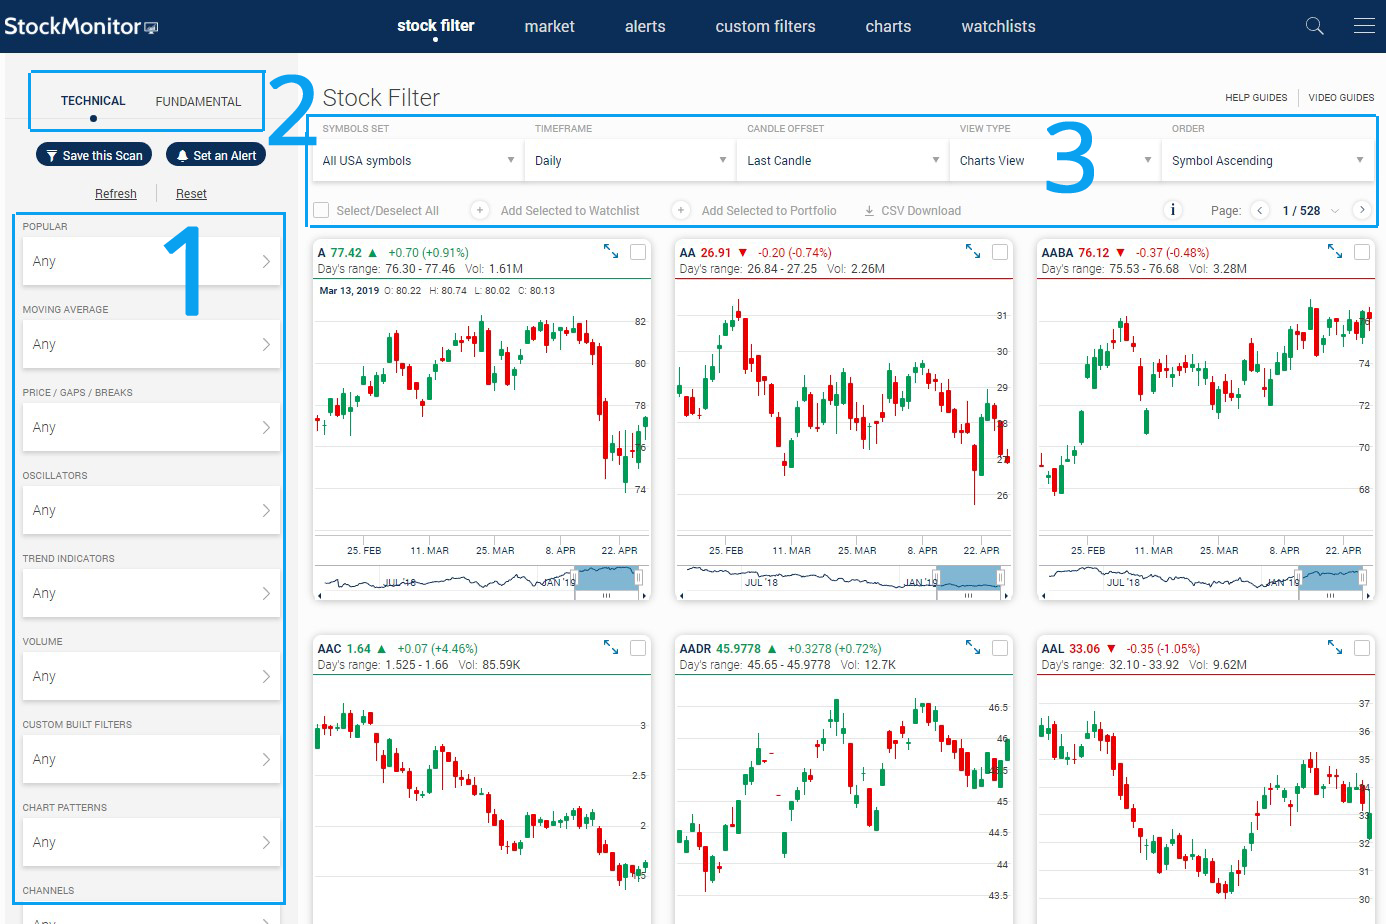
In the old version, all stock scans were located in drop down boxes on the main filter page. Every stock scan is still active, however they are how located in the left sidebar. Rather than drop down boxes, we now have expanding menus, which are easier to select from. [Number 1 on image below]
Also, you can switch between fundamentals and technical scans using the tabs, as seen in image, labelled number 2. We aimed to improve this layout with the view to adding further fundamental scans in the not to distant future.
All controls for time frames, candle offsets, sorting orders and quick add to watch lists etc are found directly above the filter results window. This is number 3 on image.
Technical Stock Charts
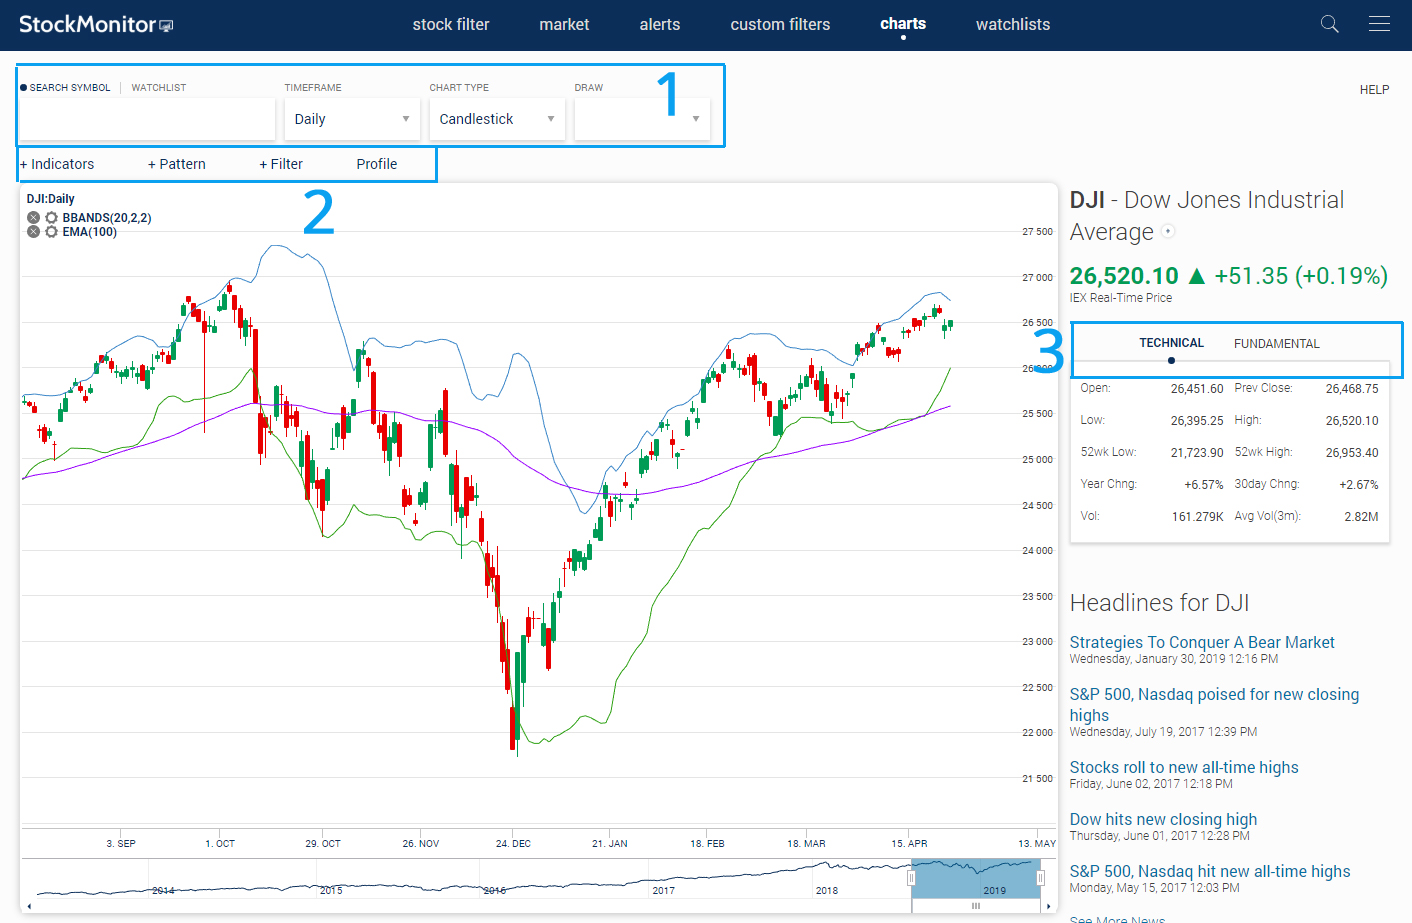
The layout of the main stock chart and quote detail page has not changed too much, but is now easier to navigate. In the box labelled 1 on the image below you will find the symbol switcher box and timeframes/chart views etc.
In the box labelled 2 are the controls for adding indicators, filters, candle patterns and your profiles. Over on the sidebar you will now find the basic fundamental details on the switchable tab. Labelled 3.
Custom Filter Builder Tool
One of the best improvements in our view is the custom filter / stock scan builder. It is now much cleaner and easier to follow what you are building. It works in exactly the same way as before, but things should now be easier to follow when you are building stock scans with multiple conditions.
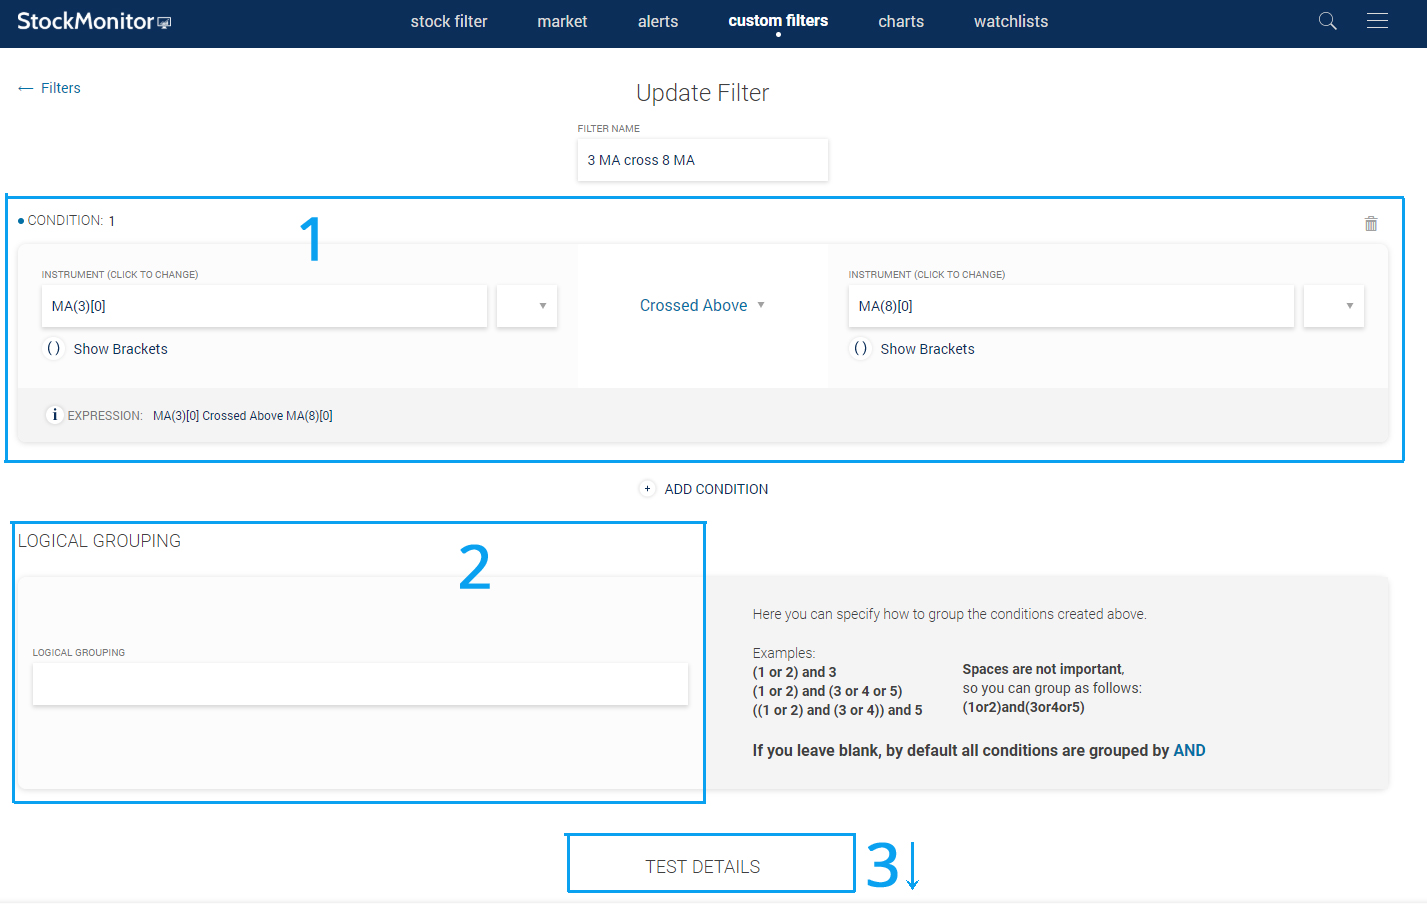
On the image below, box 1 is the new condition panels. Same idea as the previous version, you set a left instrument and a right instrument with a choice of conditions in the center box. The ability to use maths and complex calculation using brackets is still active as before.
In box 2 you can now see the logical grouping window easier, with better explanation of how it works. Here you can set things to follow grouping such as (1 OR 2) AND 3. Grouping allows you to set conditions that detect a few variations of your settings at different times.
If you scroll down beyond box 3 then all the same testing features are still as before. Being able to test using candle offsets or on particular sets of stocks etc.
Stock Portfolios
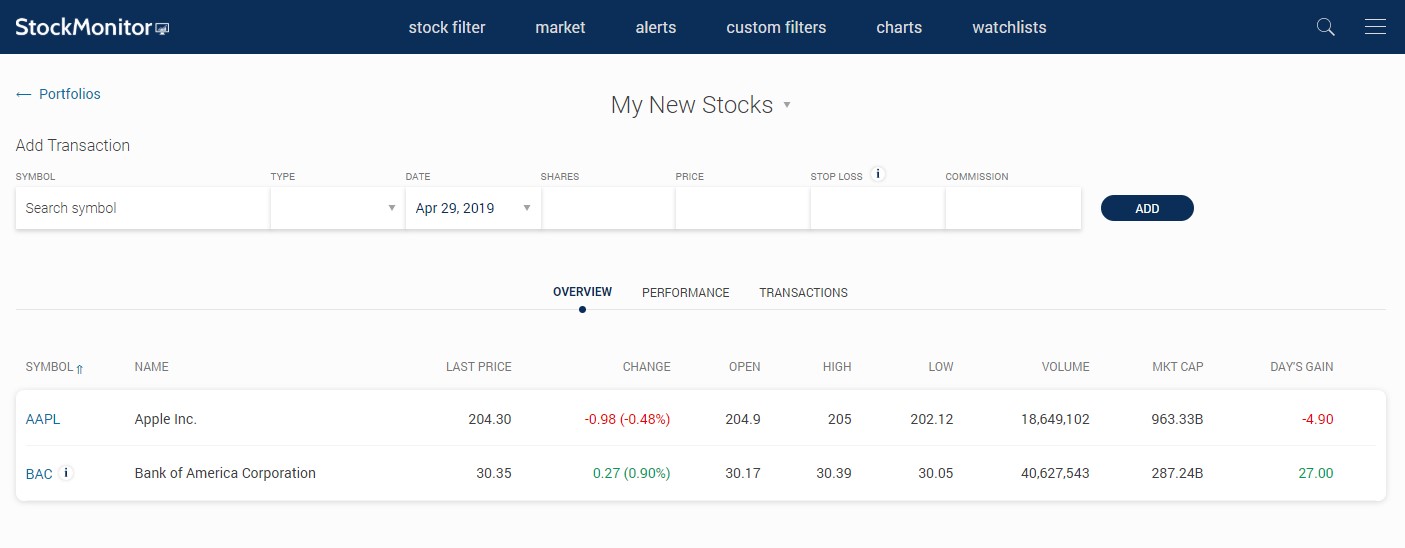
From the main sub menu you can access your portfolios. Nothing has changed here apart from the layout which is much cleaner and nicer on the eyes. You can add transactioins, stop losses and more from here as you always have before.
Back Testing Stocks
Our backtester for your custom scans is still located in the main sub menu. As with portfolios no features have changed, but the layout is now much easier to navigate and the test results are easier on the eyes also. You can check our guides and FAQ inside the platform to find useful guides on getting started.
We hope you enjoy the new design, and if you looking for further information on these feature being used please check out our brand new video guides on Youtube below..