
To save time finding this popular chart indicator pattern, the Golden Cross stock screener built into our filter pulls up all prices which make a cross each day. Without such a screener tool, you would have to flick through hundreds (if not thousands) of charts each day.
The Golden Cross stock screener saves you time, and pulls up a boat load of candidates. But the question you may ask is, how effective are Golden Crosses anyway?
For those who don’t know, it’s simply a 50 period moving average crossing above a 200 period move average. These are two popular settings for moving averages, used by many long term investors. If you invest long term, you should not be too worried about short term fluctuations in prices. You would be looking for longer term sentiment, or momentum.
If a company is built on solid financials, has a steady rising trend in price, and suddenly there’s a Golden Cross, it can bring the attention of a lot of new investors. Simply because people watch for it.
You must also be aware that for a Golden Cross to happen, and for the stock screener to detect it, then price must have been moving up for a reasonable amount of time before the cross happened.
After all, the shorter of the two moving averages is 50 period. (EG 50 days). For price to pull the 50MA up to cross above a 200 day average, then there’s already been some significant strength in the price. So, discretion is needed. Not all crosses mean that the stock is instantly a buy.
[2019 EDIT] Please note. Our platform has been fully redesigned inside since this post was written. All features still remain, but the layout and navigation is now improved.
To find any stocks that have made a Golden Cross in the past 5 days, using our stock screener, follow these quick steps.
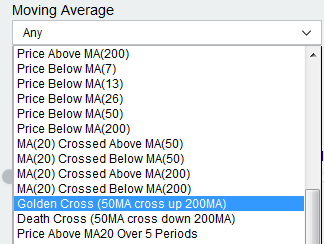
1. Visit our filter page and from the box labelled “Moving Average”, select Golden Cross as in the image below.
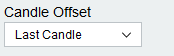
2. Initially the screener will pull up stocks that have crossed today. If you use the “Candle Offset” box (see image) you can quickly find Golden Cross patterns yesterday, 2 days ago, 3 days ago and more.
3. Save the best stocks to a watch list and perform further analysis.
Here’s some examples of a Golden Cross on a chart.
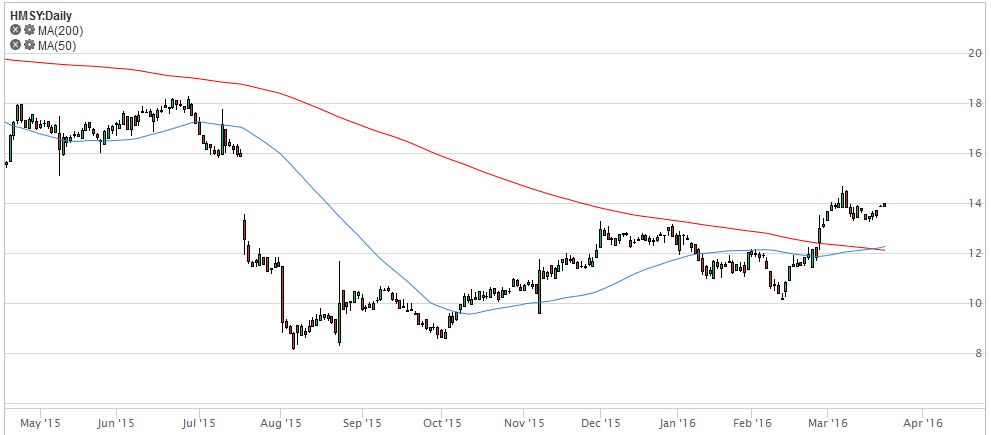
HMSY has just seen a Golden Cross after price gained from a low of $10 to current price around $14.
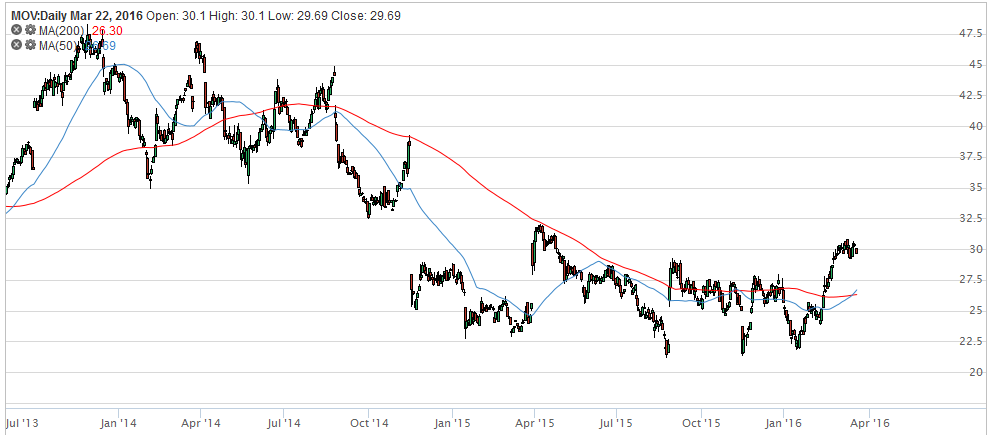
MOV has moved up to around the 52 week highs, and pulled a Golden Cross for the first time since 2012.
As you can see, these can be excellent stocks with beginnings of new momentum building. Certainly worth building them into a watch list for further research. Using a technical analysis screener will make this process a fast and easy task to complete, leaving more time for thorough research into the company’s you find.