
Using our candlestick scanner it’s easy to find popular patterns such as hammer candlesticks or engulfing candles. You can choose from a huge selection of patterns in our screener, but which ones are effective and how can they be used in your technical analysis?
Below I’ve walked through a couple of example strategies for using hammer candlesticks to find support or resistance rejections. Often these candlesticks are trying to tell you a story, namely that the price is rejected and the market sees no value, or volume, above or below the long wick that forms.
If these wicks are printed at previous highs, lows or obvious gaps in the price, it’s worth watching how stock prices behave over the coming days. More often than not and opportunity arises to make some profit.
JCP Stock Price Analysis
First up we look at JCP stock price, and right away you see a huge hammer after a gap up in February, and a resistance rejection after it has made a high. After the hammer rejection of the high, JCP stock price went on to fall from $11 to below $8. If you were long, it was a warning sign to watch for weakness, if you were looking to get short it was a heads up for a break of short term support of $11.
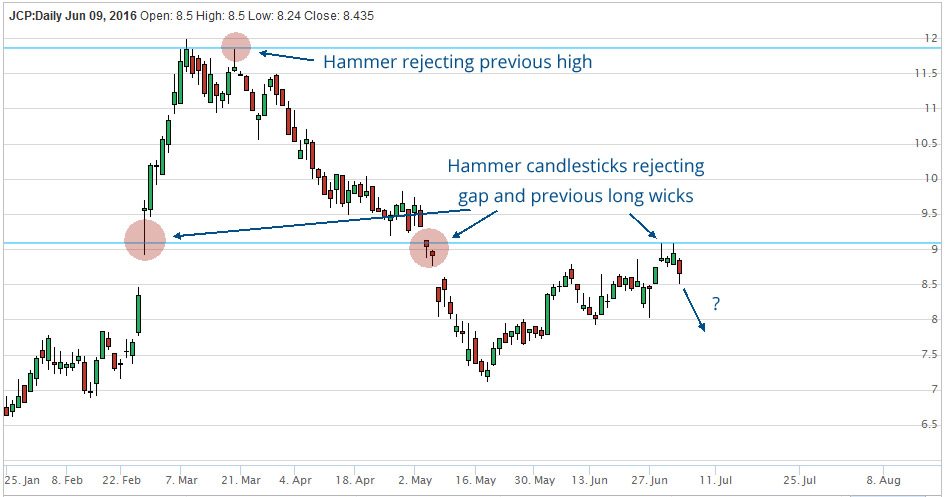
After the fall JCP stock price gapped back down through the February gap up. Which shows investors really didn’t want to trade in that price range. Then what followed was a series of rejections of the gap and candles inside. Will it head lower now? It’s not certain, but a breakout of $8 could signal some further weakness.
WMT Stock Price Analysis
Next we take a look at WMT stock price. This is a different scenario, because the stock price is in a steady trend. However the hammer candlesticks can still tell a story, even if it’s not obvious at first glance.
When stock prices are trending they often pull back to retest the last high in the trend. Traders and investors look for retraces to get in on a trend. Hammers can show us that previous highs or lows are being respected and offer some short term support or resistance.
In this example, the first hammer highlighted is a back test of the previous high. This was rejected swiftly, and WMT stock price continued meandering its way up for the whole of April.
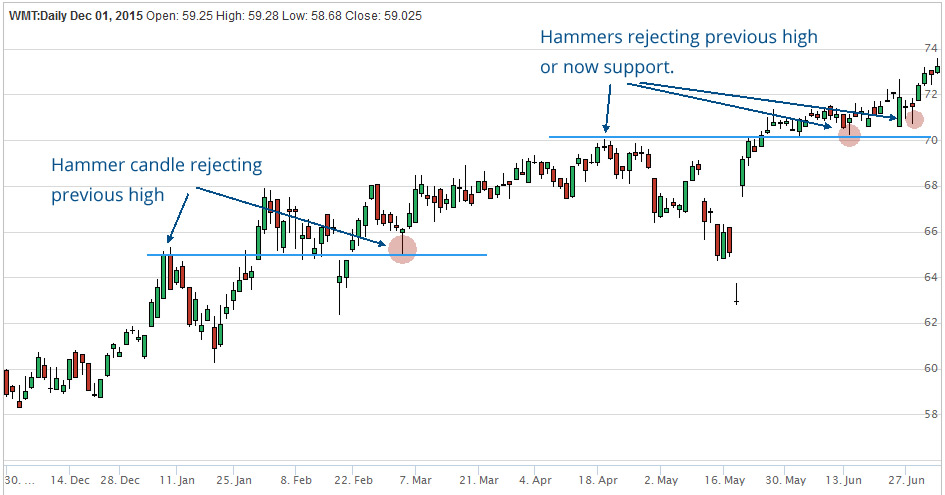
After the stock price broke the 2016 high (in May) it consolidated above it, but left a couple of small hammer candlesticks which were telling you that price is being bought each time the support is approached.
There’s interest at that level, and it should offer a place of support, or a level for a stop loss to be placed under if you entered the trade around here.
These are just two quick examples of how you can use our candlestick scanner to find interesting price action. Once you find a pattern, training your eyes to spot the support and resistance is crucial.
Have a go yourself, and begin to look left of the candles that you find. You will start to spot the important levels and build some very interesting watch lists.