
To speed up your analysis, you’ll benefit from using our MACD stock screener. This is one of the most followed chart indicators by traders and investors, because it’s based on moving averages it is very easy to understand.
In this article you will get to understand the MACD indicator and how you can use the MACD stock screener to find good opportunities on charts for an entry point.
How Does The MACD Indicator Work?
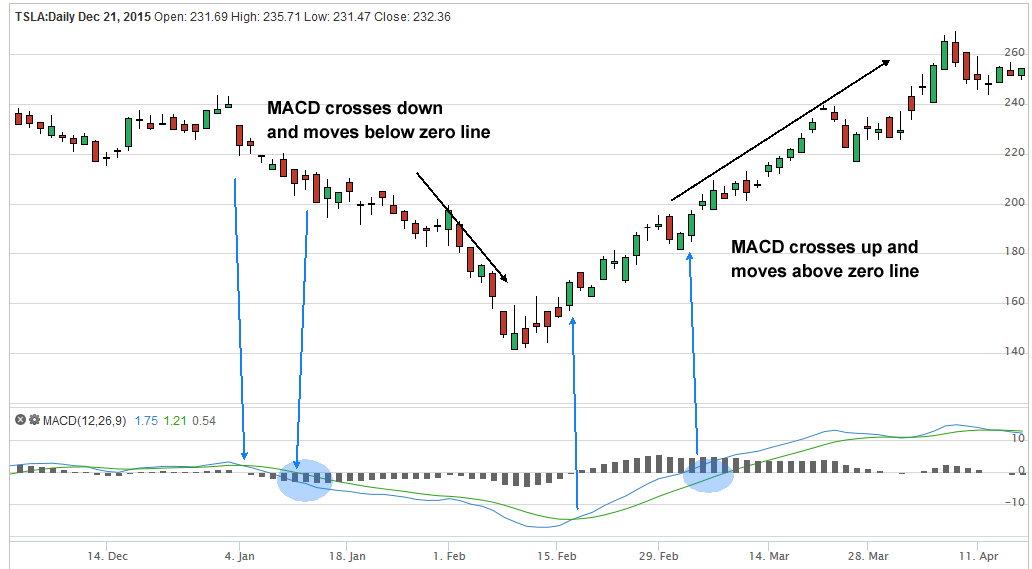
The MACD is an abbreviation for Moving Average Convergence Divergence. The indicator consists of two moving average, one is called the signal line, and the other the MACD. When the MACD crosses above the signal line it’s generally seen as a buy signal. When it crosses below, it’s a sell signal.
However, there’s also the bias towards strength and weakness which is determined by the zero line. The zero level is the mid-point of the indicator window, and if the MACD crosses above, it’s showing strength to the upside, and below selling strength. But crossing the zero line is not usually seen as a buy or sell signal on its own.
The cross ups of MACD and signal line that occur above zero will usually be better signals to buy, and crosses down which happen below the zero line more accurate sell signals.
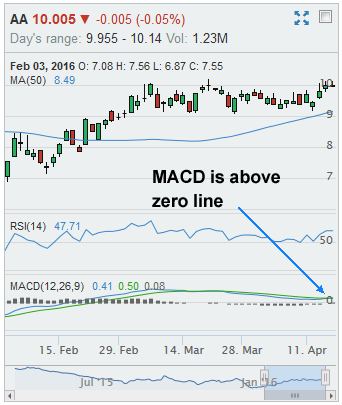
A picture can explain it better than words.
One popular way to use the MACD stock screener is to find stocks which are above a 50 period moving average, have high relative strength, and MACD crosses above the signal line whilst the level is above zero.
[2019 EDIT] Please note. Our platform has been fully redesigned inside since this post was written. All features still remain, but the layout and navigation is now improved.
This scan is easy to set up inside StockMonitor.com. For this you need to follow the next few steps.
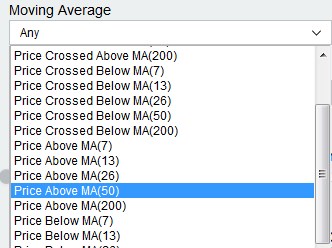
1. First of all from the Moving Average box, select “Price above MA50”.
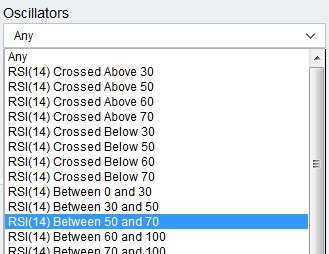
2. Next select “RSI Between 50 and 70” from the Oscillator box.
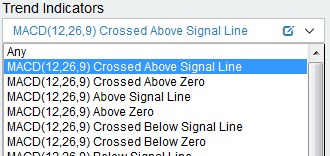
3. Last of all select “MACD Crossed Above Signal Line”.
This scan will produce a list of stocks that have high relative strength, they are above the 50 moving average and MACD has just crossed above the signal line.
Take a look through the results, and look for stocks which MACD indicator is above the zero line.
You should add these stocks to a new watch list, and monitor them for good entry points into a trend.
If you want to get more accurate results from the stock screener, you can save this whole scan as a custom filter, and modify to have add an extra criteria of “MACD greater than Specific value 0”. This will now filter out the results that do not have MACD above zero.
Using the technical analysis charts we provide you can run through your watch list and decide which stocks look the best options for a trade, based on the movement of price and your own money management strategy.
Get started now, and start using our MACD stock screener to find great trades!