
I’m just crazy about stocks with unusual volume, always have been always will be. But in addition I also like to find stocks with a bit of momentum. So in this post I’d like to share with you how to combine a few filters, and discover a bunch of new stocks to add to your watch list in StockMonitor.
First off, if you haven’t tried it yet, log in to StockMonitor, and navigate to the Filter from the top menu. You will see a selection of drop down boxes which you can select pre-built filters from. For the purpose of this article I will use some of the pre-built filters, but once you get the hang of this it’s soo easy to build your own, or just modify one to suit your needs.
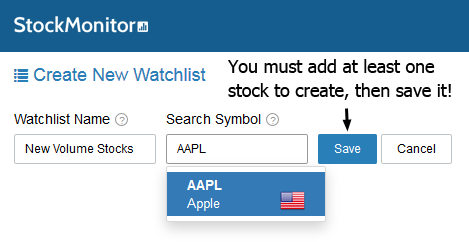
To follow this guide I suggest creating a new watch list, so we can quickly add the stocks we find, and come back to perform some analysis later.
Filters I Will Use And Why
Combining one or more filters will narrow down the candidates for a really good set of criteria. First I’ve selected “Volume Up Greater Than 100% From 30 Candles Av”. This filter will only display stocks which end of day volume (set that in timeframe box) is today above the 30 day average volume levels.
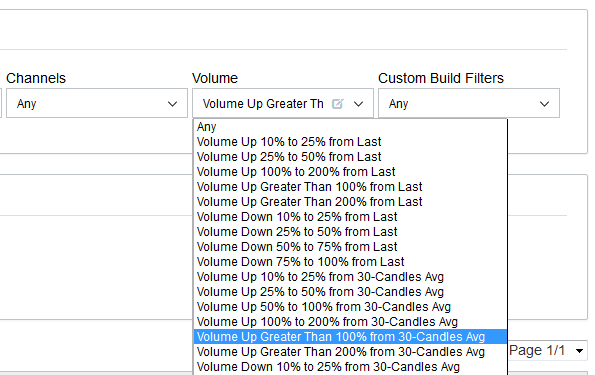
I love this filter. Because it quickly lets me see any new unusual volume stocks that have moved today. When there’s unusual volume it often means there’s been some news, a support or resistance has been broken, or a trend has started moving.
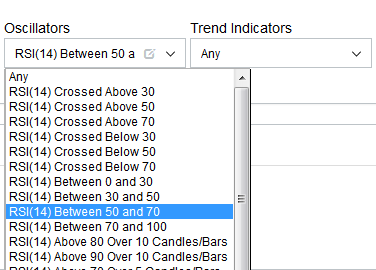
Next filter I am going to add is “RSI (14) between 50 and 70”. Why? It’s my favorite oscillator to measure momentum. Usually when RSI is above 50, and even crossing above 70, there’s strength in the stock. If there’s a trend, backed up with momentum, it’s a good opportunity.
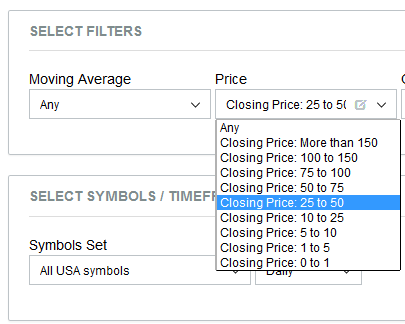
Lastly, I like to trade stocks in the 25 to 50 dollar price range, so I have selected “Closing Price: 25 to 50”.
Don’t ask me why, I just like it. For me I seem to have more success with stocks in this range, versus penny stocks or stocks with larger prices. But this filter is subjective; you can select 50 to 75, 75 to 100, or even no price range. Find what suits you.
Now I’ve selected my filters I am presented with a list of stocks whose close today is:
Volume 100%+ above the 30 day average, RSI is between 50 and 70, and price is in the 25 to 50 range.
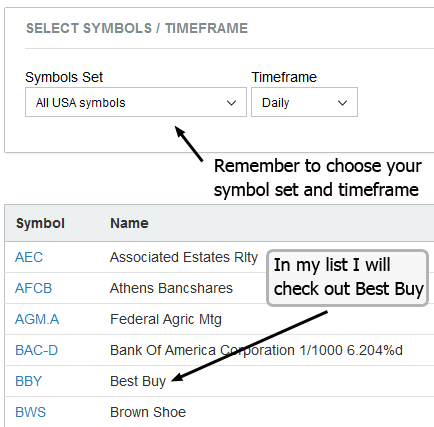
For a quick view of today’s action on a chart hit the chart icon in the row of the stock you are interested in. ![]()
Selecting Stocks To Watch
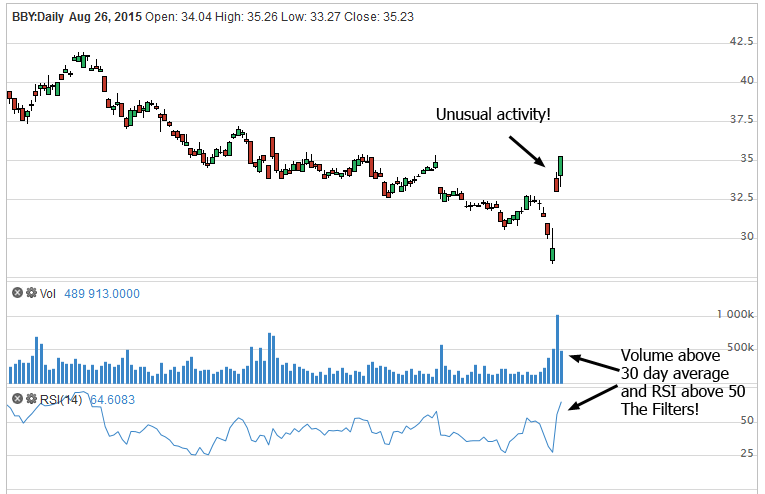
So, as you can see above, I have decided to select Best Buy as my first stock to analyze. Click the chart icon and a new window appears. In the image below I have shown that the filters do indeed work! (you don’t have to check each time). We have volume above 30 day average, and RSI above 50. You can quickly see that there’s been some unusual price activity, with a gap up and follow through in price.
Using the news window to the right of the chart, there’s a few headlines from the day of the gap up. Here’s one:
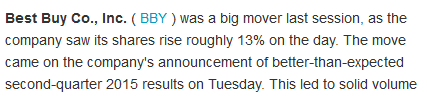
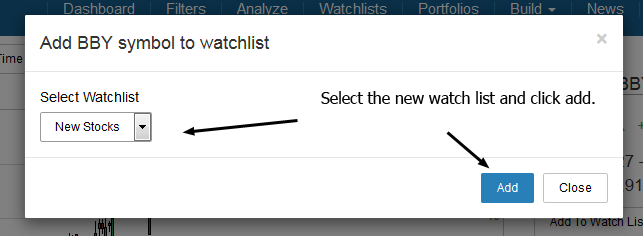
And another headline that says: Best Buy Declares Dividend, Time to Buy? Ok. So there’s some substance behind this surge in volume, let us add this one to a watch list and come back to it for further analysis, or even just keep an eye on it over the next week or two. On the chart., click the Add to Watchlist button.
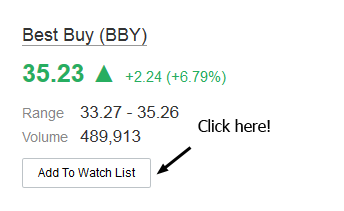
Select the correct watchlist and add the stock.
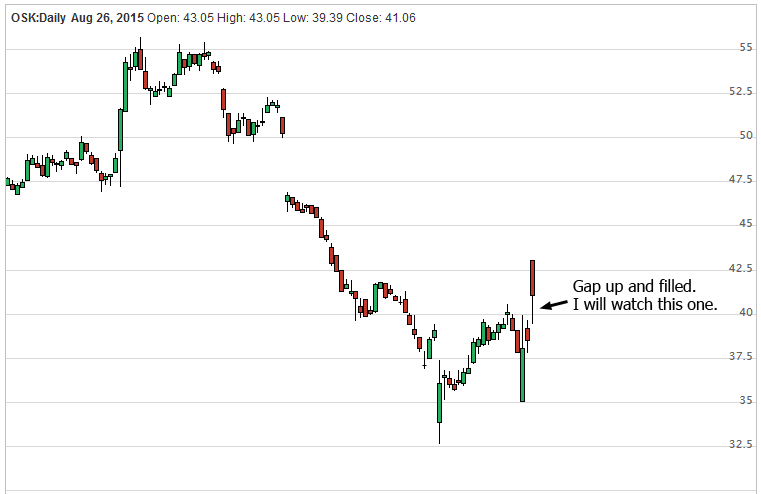
Let’s take a look at another one from the list of filtered stocks. This time I have selected a chart of OSK (Oshkosh). Again, a nice gap up at the bottom of a long down trend move. The gap was filled during the session, and there are some nice gaps above that any new trend could target. Added this to my stocks to watch list.
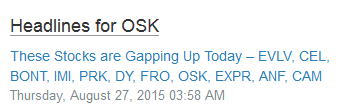
I also noted in the headlines, that this stock has just been highlighted in a newsletter for stocks which have gapped up. Great.
Now, I’ll keep repeating the process by adding stocks to this watch list every evening, until I build out 20 or 30 potential candidates for a trade. I can monitor them every day, watch news and make sure that RSI and momentum are heading in the same direction as the price.
Hopefully you can use a similar method to find the best stocks to watch, and get more from your trades!