
The relative strength indicator is one of the most widely used indicators by investors and traders alike. Here we will show you how our RSI stock screener works, and a show you the fast way to pull up lists of stocks that are overbought or oversold. An RSI indicator is deemed to be in overbought territory if the indicator crossed up above 70. However, in many situations this … [Read more...]
Get The Stock Scanner That Saves You Time
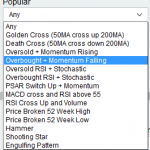
The stock scanner that we provide is super-fast for screening technical analysis and candlestick patterns. Every preset inside the scanner can be quickly cloned and adjusted to fit the need of your strategy. One of the time-saving benefits that our members get is the ability to back test the stock scans and set alerts. When our system detects a stock which meets one of your … [Read more...]
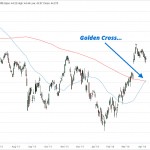
Using The Golden Cross Stock Screener To Find Stocks To Buy
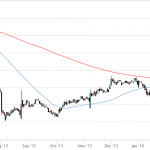
To save time finding this popular chart indicator pattern, the Golden Cross stock screener built into our filter pulls up all prices which make a cross each day. Without such a screener tool, you would have to flick through hundreds (if not thousands) of charts each day. The Golden Cross stock screener saves you time, and pulls up a boat load of candidates. But the question … [Read more...]