
The relative strength indicator is one of the most widely used indicators by investors and traders alike. Here we will show you how our RSI stock screener works, and a show you the fast way to pull up lists of stocks that are overbought or oversold.
An RSI indicator is deemed to be in overbought territory if the indicator crossed up above 70. However, in many situations this is just the beginning of being in an overbought level. This level can increase all the way up to 90 or 100 at an extreme, which means stocks can continue to stay overbought for a very long time and still move up in price.
Using our RSI stock screener you can find stocks easy that are above RSI 70, but the secret trick is to also watch for momentum to begin falling whilst the stock is overbought, and to confirm the overbought status with the stochastic indicator. We can show you this too!
[2019 EDIT] Please note. Our platform has been fully redesigned inside since this post was written. All features still remain, but the layout and navigation is now improved.
How The RSI Screener Works
On the main filter page, we recently build a new box called “Popular”. Inside this box there is an option to filter “Overbought + Momentum Falling”.
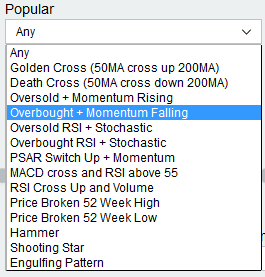
When you select this option, it will display stocks which have these characteristics in the indicators.
- RSI Indicator level greater than 70
- Stochastic (Fast setting) greater than 90
- Momentum decreasing for previous 3 days
What this means is the RSI stock screener has found stocks that are in high overbought situations, yet momentum seems to be dropping off. This can be a good scan for one of two things.
The price has hit a resistance, and may turn down.
This could be a pullback in a trend, and offer an opportunity soon to jump on board.
With either of these you need to understand basic support or resistance.
For example, if this is a pullback in a trend, you may want to add the stock to your watch list and look for it to retrace back to a previous high, or an area it broke above recently, before deciding if the stock fits your risk profile.
If it is a turning point, you might want to be sure that the level it began to retrace from was a string resistance in the past. Zooming out on a technical analysis chart to view a few years of data will show you.
We have the exact opposite of this filter in the “Popular” box too. It will find stocks that are oversold, and momentum has been rising for 3 days. Check “Oversold + Momentum Rising”.
In addition to our preset filter, you can also customize any of the RSI screeners in the box named “Oscillators”.
When you run a filter, an “edit or clone” button appears. By clicking this you can adjust the levels or add further criteria to the scan, easily, using our custom filter builder. Save the new filter, and it will be available in your custom list each time you visit.
Get started now and begin finding overbought and oversold stocks.