
Everyone is looking for the best stocks to buy. Obviously we all wish we knew what they were, but one of the best ways of getting an advantage is by using a technical analysis stock screener to inform you when a stock is looking oversold or beginning to gain strength.
Traders and investors look for different technical indicator signals in various timeframes, so in this article I will show you a couple of examples which you could start testing and see if they help you find the best stocks to buy.
Breakout Stocks With Strong RSI
If a stock breaks a psychological level, maybe a 2 month high or a resistance, you can be sure it will be picked up by many traders on their screeners. The trick is not to buy all stocks that break highs, but select ones with the most strength behind the move. You can use our stock breakout screener to find them fast.
Using RSI (Relative Strength Index) is a good gauge to whether the move has been building for a while before the break out. If there was no strength in the move prior to breakout then it can often be a news spike that may retrace.
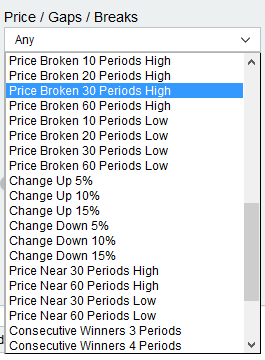
First, select your index (such as the S&P500) and go to our box titled “Price/Gaps/Break” on the main filter, and run “Price Broken 30 Periods High”. As it states, this will only show stocks whose move today has made a new 30 day high.
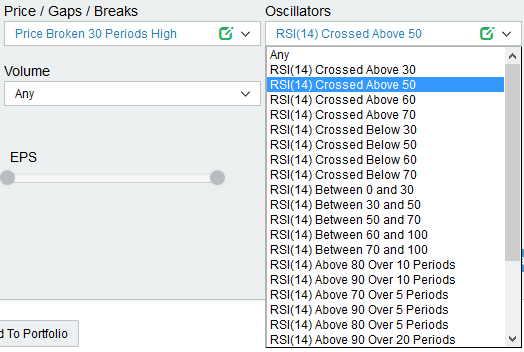
Once you have this filter selected you can then run a 2nd filter from the Oscillators box of “RSI (14) Crossed Above 50”. When RSI crosses above the 50 line, it is deemed as moving from negative to positive strength.
This will now narrow down the results to only breakouts which occurred with an RSI cross. If you like the look of these stocks in the charts below the main filter area, select the “eye” icon on the corner of each chart and add them to a watch list.
Add these stocks to a watchlist each day, and begin to follow their movements. If the trend continues above the 30 day high, you might find some of the best stocks to buy this way.
Oversold Stocks With Rising Momentum
Everyone loves to find oversold stocks. They can be the best stocks to buy if you pick the right ones. However, an oversold stock can stay oversold for a long time, so you need to use a screener to indicator when the momentum could be changing.
In the box titled “Popular” you can use our pre-set filter named “Oversold and Momentum Rising”. This takes RSI and Stochastic to find oversold levels, but combines a rising 10 period momentum indicator.
So the results displayed in the charts below the filter will show stocks which have been falling but momentum is beginning to rise.
The trick here is not to simply buy these stocks, but to add them to your monitor and view the charts each day. The best stocks to buy based on this filter will usually come after a bounce from a support. It may be an all-time low, a 52 week low or maybe a previous support level.
For instance, on the chart below, USDP was detected by this filter 3 days ago to be oversold but have rising momentum. When you zoom out on the chart you can see clearly that even though this stock was short term oversold, longer term it is in an upward trend. This could be a good stock to buy.
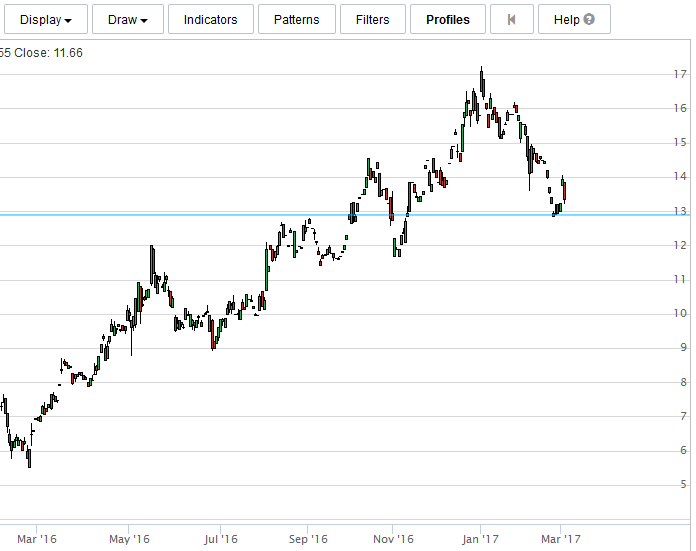
The low touched just above a previous high from late last year, which could offer support, and momentum is rising. This might be a “dip” which presents a good entry point. It also presents a good place for a stop loss below that support, for you to manage your risk.
Take the best results from this screener each day, add them to a watchlist and begin to find some of the best stocks you can buy based on technical levels.