
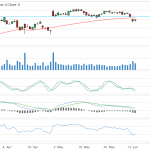
After 4 days of downside across the main US indices, futures seem to be pointing to a higher open on Wednesday 15th June. Whether this strength last throughout the session remains to be seen, but here we run our scans on some stocks with potential to move today based on our technical indicator screeners. First of all (CRM) Salesforce we featured in our last blog post here, … [Read more...]
Technical Analysis and Screener on SBUX, CRM and BIDU
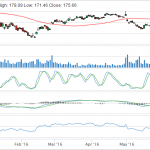
Recent strength in the US stock market has given a lift to a whole bunch of stocks. Here we run our stock scanner and technical analysis charts over a few of our members most watched stocks. Starbucks (SBUX) stock price has been on the move from a two month low of just above $54. Firstly, running our scan for MACD cross up, we see that the MACD is crossing up for the first … [Read more...]
Brand New Stock Portfolio Features We Added
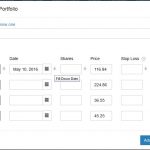
We’ve recently added some updates to our stock portfolio; this post is going to explain what they are, how you can use them and why they are important. One of the features users have frequently requested is to have the ability to add stocks in bulk from the stock lists they produce from their scans. We have now added this feature, but rather than just stop there we also s … [Read more...]
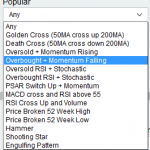
How To Find Overbought or Oversold Stocks Easy
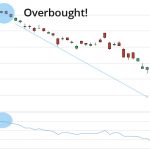
If you’d like to find the most overbought or oversold stocks today, or any day, we’ve made this really simple to do inside stockmonitor.com. With the new addition of popular stock scans to our technical analysis screener you can find overbought stocks in seconds. In this article I’ll quickly run over what our scanner looks for, how it determines whether a stock is oversold or … [Read more...]
Using Our RSI Stock Screener For Fast Overbought/Oversold Analysis
The relative strength indicator is one of the most widely used indicators by investors and traders alike. Here we will show you how our RSI stock screener works, and a show you the fast way to pull up lists of stocks that are overbought or oversold. An RSI indicator is deemed to be in overbought territory if the indicator crossed up above 70. However, in many situations this … [Read more...]