
Whilst a lot of traders buy trending stocks which are breaking out higher, there’s also a large camp who like to buy the dips. If you can identify an edge which offers a low risk entry into a trending stock, you can catch a good move early.
Here’s a neat way to use our low RSI screener to pull up a bunch of candidates for your watch lists. But first of all you will need a free trial of our platform, click the button below.
Low RSI At Support Levels
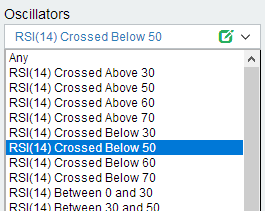
When RSI crosses below 50 it is a signal of weakness in a stock, and if approaching a recent low, can offer a good entry into a trend. Use our screener to identify low RSI and then check the mini charts for the results which have pulled back, but are holding above a recent high, or an obvious support level. Here is the RSI in the Oscillators box on our main filter area.
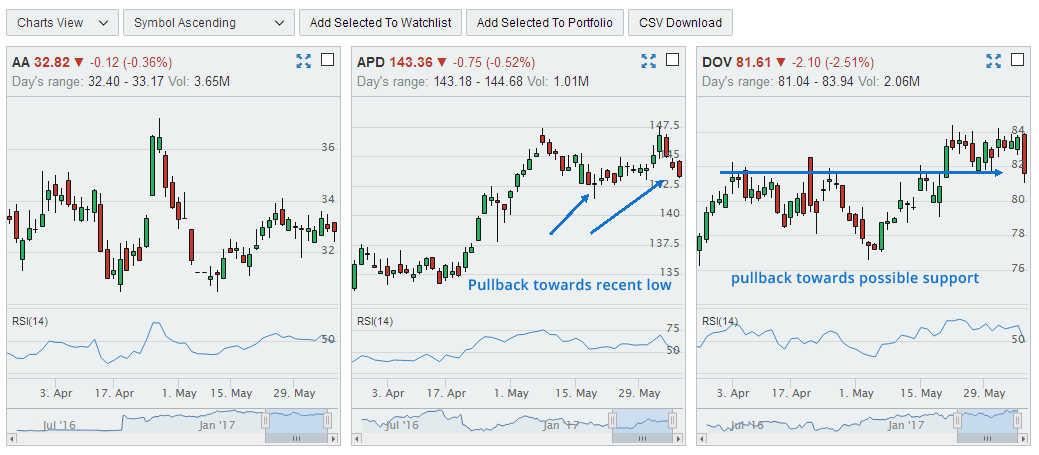
So now you have a set of results, look for the ones which seem to have pulled back towards a recent high and price is currently in an upward trend. I highlighted two on the mini charts below which would fit this criteria, one had pulled back towards a recent low, one has pulled back towards a support level (which was resistance before shown by the horizontal line).
Select the ones that look good and add them to a watch list, then you can set an alert for a price increase on the stocks in your list. When you get your alert email, check the charts and decide if a trade is possible (using your risk profile).
Add Stocks To Watch List
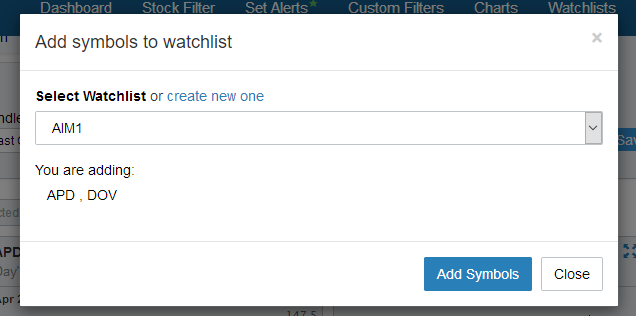
Directly from the mini charts you select the check box on each stock you would like to save, then click “Add Selected To Watchlist” button in the menu above the results. This will open a prompt box asking whether you want to add them to a previous watch list (select which list from the drop down box) or create a new one. You can create as many watchlists as you need, so don’t be afraid to organize your stocks into date named lists, or even named by sector or price range.
Now that you have a watchlist of stocks that are retracing with lower RSI, you can set an alert for when stocks in this list begin to rise again.
Setting Stock Alerts
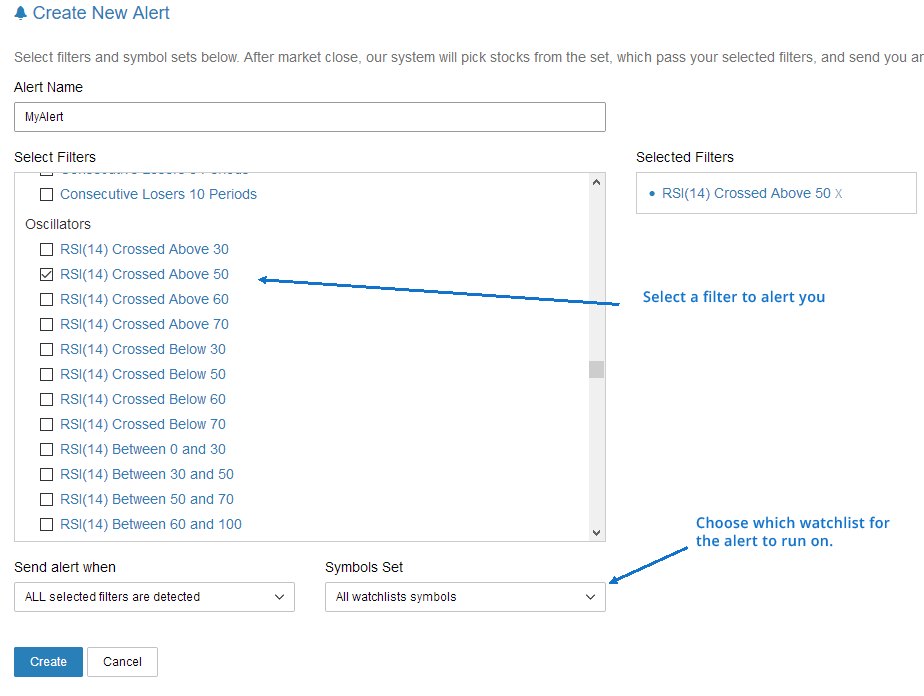
Go to set alerts section and select a filter for a heads up when these stocks are beginning to move upwards again. In this case I have selected RSI crossing above 50 once again, but you can choose any other, or even better create you own. One simple custom filter could simply be close[0] > close[-1] which would alert you when a stock in this list has closed up compared to yesterday (-1 is yesterdays close). See our guides on creating your own custom filter, it’s really easy.
Wait for your alerts and begin to check the charts. Are the stocks you have picked still in an uptrend? Is the risk (a break of support or low) worth taking? Make sure you have a plan for these trades and perform some analysis on the stocks. You may find a gem in there!
Want to know more?
Learn about scanning for candlestick patterns here or maybe take a look at how to identify breakout stocks and profit from them.