
Unusual volume stocks, why should I care? Well, it’s a fact that when there is a high increase in volume, then there is often an opportunity to profit from activity.
Sometimes a yearly high has been broken, sometimes a 30 day low. Maybe there has been a news announcement and a stock has broken long term support or resistance.
You job as a trader, or investor, is to quickly identify these opportunities and analyze them quickly before the action stops. This is where our stock filter comes in SO HANDY.
Inside StockMonitor.com you can quickly scan thousands of stocks, from the UK or USA that have had really strange volume. With one click you will get a list of stocks, and be able to quickly view a chart of each to see which one have an opportunity to make a profit from.
 By zooming in and out on the chart, you will quickly see if any technical areas have been broken, and if there are any targets coming up. From this analysis you will be able to find stocks that fit your risk/reward profile and make some decent trades.
Technical Areas To Be Aware Of
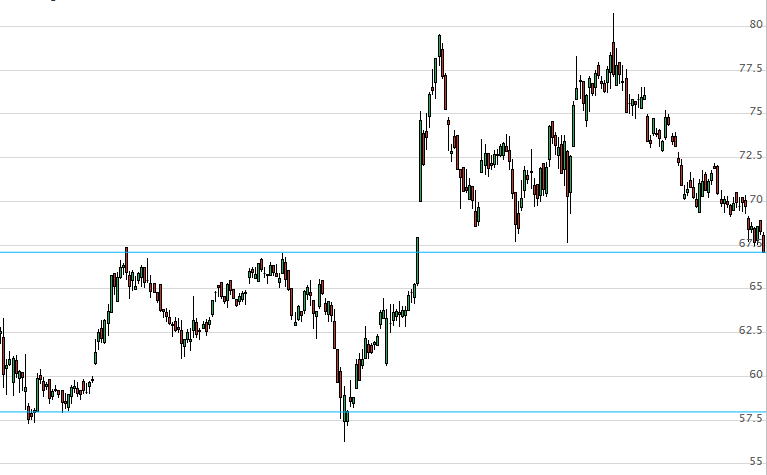
Support and Resistance. Zoom out on a chart and see if any highs or lows have been broken. The more times these areas have been touched in the past, the more powerful the break could be. Moves back into the range that has been broken can be used as your stop loss areas.
Trendline Breaks. Draw a line over recent tops and recent lows. Has this trend now been broken? If so, then maybe it’s time to add the stock to a watch list and monitor for unusual moves over the coming days. Moves back into the broken trend can be used for stop loss areas.
30 Day High / Low Breakouts. You can use any amount of days (30/60/100) but more often than not other traders are watching the 30 day levels. If it breaks out, watch for further movement. Is a new trend forming beyond this breakout?
Breakaway Gaps. Did the current move leave a gap? Has it gapped above or below support or resistance? If the move continues, and doesn’t return to “fill the gap”, then it could be the start of a new trend, backed up with buying volume increasing, watch these stocks!
These are just some of the scenarios you should be watching for. There are many more.
Perform Deeper Stock Analysis
Any stocks with unusual volume you find, add the interesting ones to a new watch list. You can then use the filter again to run even deeper analysis on this list of stocks.
Set the filter only to run on this new watch list, then test out some moving average filters, relative strength indicator levels and more. If any of these breakouts are backed up by momentum then they could be the best opportunities to make profit from.
Often when a stock relative strength breaks above 50 or 70, it is about to make a decent move. This is especially so if a support or resistance has recently been broken.
The possibilities are endless. You can even build your own filter, quickly with our custom stock filter and run this on your watch lists. Maybe there is another indicator you want to confirm before you trade.
The choice is yours.
Get started today for free, and test the ideas above.
Watch our tutorial video below for further guidance on how to use a stock filter to find unusual volume stocks.