
As a trader your first job is to identify momentum opportunities. There’s no point trading a stock that is stuck in a tight range or with very little movement going on. One of the easiest ways to identify a stock that is gaining momentum is to watch the relative strength index (RSI) indicator.
RSI is a calculation based around the average closes up and down over a given period.
RSI = 100 – 100/(1 + RS*)
In this calculation RS = Average of x days’ up closes / Average of x days’ down closes.
The range between a high reading and low reading is 0 to 100. If the RSI is strong it is usually noted above 70. If it is weak, usually below 30.
Now, many traders use this indicator to tell them when a stock is “overbought” or “oversold”.
You can, I guess.
But you can easily lose your shirt by trading in the opposite direction to overbought and oversold indicators.
If the market is particularly strong, a stock can stay overbought for a very long time. Each small pullback in your indicators will be met with another upward surge, whilst the trend continues.
You don’t want to be short in those conditions.
Why Not Use RSI Like This?
The beauty in relative strength (in my opinion) is to use it to gauge strength!
After all, the clue is in the name.
If you find stocks that have recently crossed the 70 level in RSI, it often presents an opportunity to grab a small slice of the upward momentum. Here’s a way to find those opportunities and a way to study them for a trade.
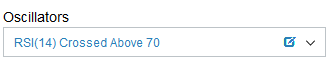
Go to our filter and select the RSI Crossed above 70 filter (see Image). This will present you with a bunch of candidates where that has happened today. Take your pick of these stocks, look for ones that are in a trending move, or breaking out and add them to a new watch list.
For a trading opportunity, look for breaks above the previous day highs or closes. Often you can grab a good move when a new high is being made.
Want To See How It Worked Before?
On our filter tool you will see the feature “Candle Offset” (See image).
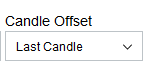
If you select previous day, it will show you stocks which crossed above RSI 70 yesterday, and you can see how they behaved today. Also go check out 2 candles ago, or 3 candles ago ( you get the idea?).
I’m pretty sure you will see what can happen to stocks with high momentum, in a strong trend.
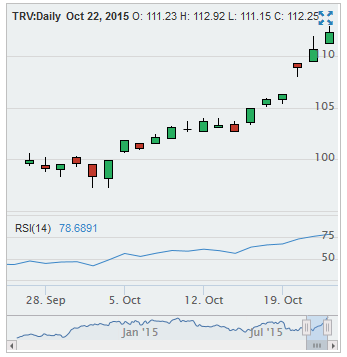
For instance, here’s a chart of one whose RSI crossed 70 two candles ago.
Sign up free today, and start finding new stocks to watch!
Small Warning!
Indicators are usually more effective on stocks with decent liquidity. That doesn’t say they are not useful for smaller stocks with little volume, but when trading it may be best to stick with trades when the stock has reasonable volume levels. Do your own research!