
As we recently updated the filter in Stockmonitor.com to enable chart view for the stocks it finds, we have now also updated the free public filter tool too. So now whenever you run a quick scan of the market, each stock it picks can be seen in a mini chart with the indicator of the filter included.
For instance, here is a small chart from running “Price crossed above 50 MA” filter..
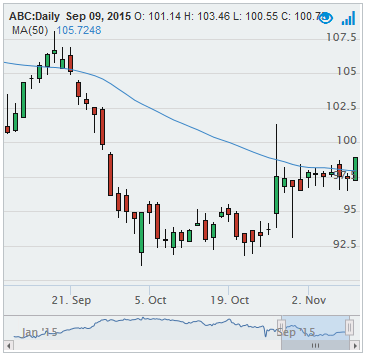
We think you’ll agree this is a much better way to see the stocks it picks, and there’s also the added feature of being able to hit the button on each chart to add to watch list.
New Filters Added In Pre-Sets
Also in this update we added a couple of new pre-set filters. Now you can see candle high and low breaks, 10, 20, 30 and 60 day new highs or lows are detected. And also we added Bollinger Band expansion and contraction filters.
When Bollinger Bands contract it means the stock is in a small range, often meaning a breakout will occur very soon. It’s worth keeping an eye on stocks which show contraction during trending periods, for continuation.
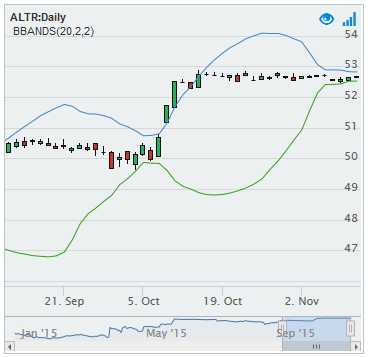
Conversely Bollinger Bands expansion shows when the indicator is widening after a contraction, so the breakout may be beginning to happen.
Candle Offset
You can also see the previous days for each filter with the candle offset. So, select an RSI crossed above 70 filter, and see today’s results, yesterdays results and more going back a week. This is useful for an overview of how a filter might perform in the short term.
We hope you can get to use these features to their full potential.